The problem isn't survey frequency. It's survey design. Short, frequent pulse surveys only work when they ask the right questions and when results connect to real action. Without both, you're just collecting numbers.
This article gives you 30 ready-to-use pulse survey questions organized across six categories — engagement, leadership, DEI, development, wellbeing, and open-ended — plus benchmark context so you know what "good" actually looks like.
Key Takeaways
- Pulse surveys are short (5–20 questions), frequent check-ins that catch problems annual surveys miss entirely
- The 30 questions here span six categories: engagement, leadership, DEI, career development, wellbeing, and open-ended feedback
- Benchmarks from Culture Amp show typical midpoint scores — use them to prioritize action, not just report data
- Anonymity drives honesty — 82% of employees share more critical feedback when anonymity is guaranteed (SHRM, 2020)
- Acting on results matters as much as asking the questions — ignored feedback erodes trust faster than no survey at all
What Makes an Effective Pulse Survey Question
The Core Principles
A good pulse survey question is specific, actionable, and tied to a consistent rating scale. Avoid vague prompts like "Are you happy at work?" and instead use targeted statements on a 5-point Likert scale (Strongly Disagree to Strongly Agree). Both Culture Amp and SHRM back this format — it gives respondents enough gradation to reflect real sentiment without making the survey feel burdensome. Phrasing questions as positive statements ("I feel proud to work here") also keeps scoring and benchmarking consistent across cycles.
Structuring Your Question Mix
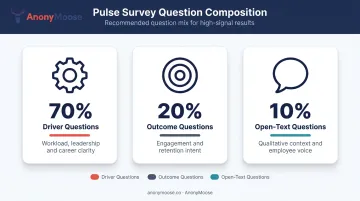
A balanced pulse survey typically breaks down like this:
- ~70% driver questions — what causes or reduces engagement (workload, leadership communication, career clarity)
- ~20% outcome questions — overall engagement and retention intent
- ~10% open-text questions — qualitative context that numbers alone can't capture
That ratio keeps you tracking measurable trends while leaving room for the nuance that raw scores miss — which matters most when you're deciding what to act on.
The Real Cause of Survey Fatigue
McKinsey's research is direct on this point: survey fatigue is a leadership problem, not a frequency problem. Employees disengage when their feedback disappears without acknowledgment or visible follow-through.
Only ask questions your organization is prepared to act on — and tie selection to current HR initiatives or business priorities. When employees see their input reflected in decisions, participation holds.
30 Essential Employee Pulse Survey Questions and Benchmarks
These questions are organized into six categories covering the most critical dimensions of employee experience. Benchmarks reflect Culture Amp's 40th–60th percentile midrange as a typical performance indicator, with bottom and top quartile thresholds where available.
Employee Engagement Index
Engagement index questions measure the core outcomes: pride, advocacy, present commitment, future commitment, and discretionary effort. A multi-question index is more reliable than eNPS alone because no single question captures the full picture of engagement.
The five questions:
- "I am proud to work for [Company]."
- "I would recommend [Company] as a great place to work."
- "I rarely think about looking for a job at another company."
- "I see myself still working at [Company] in two years' time."
- "[Company] motivates me to go beyond what I would in a similar role elsewhere."
Benchmark context (Culture Amp, 2026):
| Question | Bottom Quartile | Midrange (40th–60th %ile) | Top Quartile |
|---|---|---|---|
| Proud to work here | ≤76% | 81–86% | ≥90% |
| Would recommend | ≤72% | 77–83% | ≥87% |
| Rarely think about leaving | ≤48% | 53–59% | ≥64% |
| See myself here in 2 years | ≤59% | 64–69% | ≥74% |
| Motivates extra effort | ≤59% | 64–70% | ≥75% |
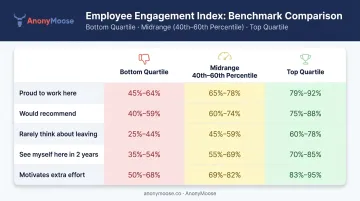
The "rarely think about leaving" question sits 20+ points below pride — that gap is normal. Scores below 40% on that item signal active retention risk. Culture Amp also flags that low present commitment combined with high future commitment is a pattern worth investigating.
Leadership and Management
Leadership questions reveal whether employees trust, understand, and feel supported by both their managers and senior leaders. Low leadership scores are frequently the root cause of disengagement in otherwise healthy organizations — and Culture Amp's research shows a decline in leadership perception can trigger a 10% drop in overall engagement, with perceptions taking 3–6 months to recover.
The five questions:
- "The leaders at [Company] keep people informed about what is happening."
- "My manager is a great role model for employees."
- "The leaders at [Company] have communicated a vision that motivates me."
- "I feel comfortable sharing honest feedback with my manager."
- "My manager supports my career goals and development."
Benchmark context:
| Question | Bottom Quartile | Midrange | Top Quartile |
|---|---|---|---|
| Leaders keep people informed | ≤61% | 67–73% | ≥78% |
| Manager is a great role model | ≤75% | 79–83% | ≥86% |
| Vision that motivates me | ≤55% | 62–69% | — |
The vision question typically scores 4–7 points below "keeps people informed." That gap isn't a communication failure — it's a storytelling and meaning-making gap. Leaders who share updates without connecting them to purpose consistently see it. Use this delta as a coaching prompt, not just a score.
DEI and Belonging
Belonging and psychological safety questions reveal whether employees feel included, respected, and safe to speak up. These scores are critical for reducing turnover among underrepresented groups and for identifying hidden bias in team dynamics.
DEI questions require a higher bar for anonymity than other survey categories. Employees from marginalized groups correctly assess retaliation risks — without genuine confidentiality, scores inflate and real problems stay hidden.
The five questions:
- "I feel a sense of belonging at this organization."
- "Every employee at [Company] has equal opportunities to succeed."
- "I feel safe expressing my opinions and ideas at work without fear of retaliation."
- "People of all backgrounds are treated with respect at [Company]."
- "New and diverse employees will feel welcomed and included here."
Benchmark context: BetterUp's research links high workplace belonging to a 56% increase in job performance, 50% reduction in turnover risk, and 75% fewer sick days. On psychological safety specifically, McKinsey found only 43% of employees reported a positive team climate in global survey data.
Always segment DEI results by gender, ethnicity, and tenure. McKinsey's research found LGBTQ+ employees were 1.4x more likely than straight and cisgender employees to cite loss of connectivity and belonging. A company-wide belonging score of 75% can mask the fact that only 52% of underrepresented employees agree. Research from Quantum Workplace found that anonymous communication programs drive a 35% increase in employees' sense of belonging — a figure that reflects how much the channel itself, not just the content of the conversation, shapes whether employees feel genuinely included.
Career Growth and Development
Development questions are among the most reliable engagement drivers across industries. MIT Sloan research citing Pew data found 63% of employees who quit in 2021 cited lack of advancement opportunities as a primary reason — and McKinsey identified career development as the most common reason given for voluntary departure.
Don't equate development with promotions alone. Lateral moves, skill-building, and meaningful contribution carry equal weight for most employees.
The five questions:
- "I believe there are good career opportunities for me at [Company]."
- "My manager has shown genuine interest in my career aspirations."
- "I am given sufficient opportunities to learn and develop new skills at work."
- "I know what I need to do to advance or grow in my role."
- "This is a great place for me to contribute to my professional development."
Benchmark context:
| Question | Bottom Quartile | Midrange | Top Quartile |
|---|---|---|---|
| Good career opportunities | ≤51% | 57–63% | — |
| Access to learning/development | ≤65% | 71–76% | ≥80% |
The career-opportunities midrange (57–63%) runs roughly 20 points below the pride midrange (81–86%). That gap is common but not acceptable. Gallup found younger workers saw 5–9 point drops in feeling they have opportunities to learn and grow since 2020 — making development questions particularly high-stakes for retaining early-career employees and high performers.
Wellbeing and Work-Life Balance
Burnout and workload imbalance are now leading drivers of disengagement and turnover. Track these scores alongside absence data to identify at-risk teams before problems compound.
The five questions:
- "I am satisfied with my current work-life balance."
- "My workload is manageable and sustainable."
- "I am able to disconnect from work during personal time."
- "My manager and team provide enough support to help me manage my workload."
- "[Company] demonstrates a genuine commitment to employee mental health and wellbeing."
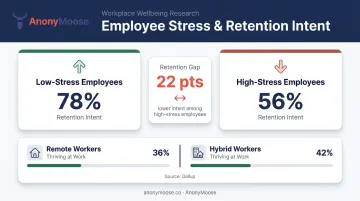
Benchmark context: Gallup's 2025 research shows a work-model paradox: fully remote workers report higher engagement but lower life thriving (36% thriving) compared to hybrid workers (42% thriving). Perceptyx data found retention intent at 78% among low-stress employees versus 56% among high-stress employees — a 22-point gap that makes workload monitoring a direct retention lever.
Wellbeing scores should never be read in isolation. Pair them with turnover and absence trends to see where pressure is concentrated.
Open-Ended Questions
Open-ended questions reveal nuance and unexpected concerns that scaled items miss. Keep them to 1–2 per survey cycle to avoid fatigue. AI-assisted text analysis can identify themes across high response volumes when manual review isn't feasible.
The five questions to rotate through:
- "What is one thing that would most improve your experience at [Company] right now?"
- "What aspect of your role do you find most meaningful or motivating?"
- "Is there something we haven't asked about that you'd like leadership to know?"
- "How can your manager or leadership better support your success?"
- "What is one change that would make [Company] a better place to work?"
Use one or two of these per cycle rather than all five. Questions 1 and 3 consistently surface the most operationally useful feedback — they give employees space to raise issues that pre-set questions miss entirely.
How to Interpret Pulse Survey Benchmark Scores
The Three Tiers
| Tier | What It Means | Example (Career Opportunities) |
|---|---|---|
| Bottom quartile | Active problem requiring attention | ≤51% agreement |
| Benchmark midrange | Typical performance | 57–63% agreement |
| Top quartile | High-performing employee experience | Varies by item |
Culture Amp calculates these ranges from aggregated, anonymized customer data across thousands of organizations — giving you a grounded comparison point, not just an aspirational target.
Internal Trends Often Matter More
A score sitting in the midrange that has dropped significantly over two quarters is more urgent than a static low score that's been slowly improving. Establish your baseline across at least two survey cycles before drawing firm conclusions. Treat any item that moves meaningfully in either direction as a follow-up priority.
Use your internal trend line to evaluate whether an intervention is working, and external benchmarks to calibrate where you stand relative to peers. Each answers a different question.
Segment Results to Surface Hidden Gaps
Company-wide scores can mask critical demographic disparities. A belonging score of 75% overall may mean only 52% of women or employees from underrepresented groups actually agree.
Organizations with more than 50 employees should segment results across:
- Department and team
- Tenure (new hires vs. long-tenured employees)
- Gender and other relevant demographics
- Role level or function
This reveals where targeted action is needed — gaps that aggregate scores quietly bury.
Anonymity design directly affects the quality of segmented data. When employees in smaller demographic groups suspect their responses could be traced, they self-censor — producing inflated scores that give leadership false confidence.
Pulse Survey Best Practices for Higher Response Rates and Honest Feedback
Cadence and Length
- Monthly surveys: 10–15 questions, completable in under 5 minutes
- Quarterly surveys: 15–20 questions, still under 5 minutes
- Culture Amp recommends keeping pulse surveys to 4–5 minutes maximum
These length limits matter, but frequency is rarely the real problem. As McKinsey notes, employees disengage when they sense their feedback is being collected but ignored — not because surveys arrive too often.
Make Anonymity a Technical Guarantee
Employees will not answer honestly about leadership, DEI, or psychological safety unless they trust their responses cannot be traced. A platform that promises anonymity in its terms of service is different from one where anonymity is technically enforced — where no individual response can be linked to a specific employee by the tool, HR, or anyone else.
AnonyMoose is built on exactly this model. Its Polls & Surveys feature uses an anonymity-by-design architecture where submissions are stored without individual identity linkage — neither AnonyMoose nor the employer organization can trace any response back to its author.
For DEI, leadership, and psychological safety questions, that architecture produces measurable differences:
- Anonymous surveys reach 90%+ participation rates versus 30% for identified surveys, according to buildempire.co.uk
- They capture 58% more honest critical feedback
That gap is the difference between useful data and noise. The SHRM Study (2020) reinforces this further: 82% of employees are more likely to share critical feedback when anonymity is guaranteed, and organizations see a 47% increase in actionable management-related feedback — exactly the category where social desirability bias is strongest in identified surveys.
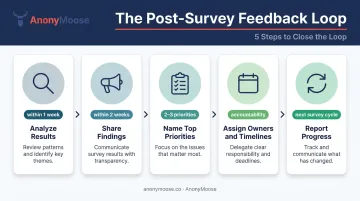
Close the Feedback Loop Publicly
Sharing results and acting on them is what sustains high response rates over time. Perceptyx data shows 74% of organizations that took action after surveys improved engagement, compared to just 8% of organizations that did not act.
The follow-up loop:
- Analyze results within one week of survey close
- Share high-level findings with all employees within 2 weeks (Culture Amp and Perceptyx both recommend this window)
- Name the top 2–3 priorities identified
- Assign owners and timelines
- Report back on progress at the start of the next cycle
AnonyMoose's Broadcast feature supports this loop directly — leadership can push findings and action updates to every employee's phone in real time, so employees see a clear line between speaking up and something actually changing.
Tailor Questions to What's Actually Happening
Avoid running the same generic template every quarter. Rotate in 1–2 questions tied to current business priorities: a restructuring, a return-to-office change, a new benefits rollout. When employees recognize that the survey reflects what's actually happening in their organization, participation and candor both improve.
Frequently Asked Questions
How many questions should an employee pulse survey have?
Monthly surveys work best at 10–15 questions; quarterly surveys at 15–20. The survey should take no more than 5 minutes to complete. Fewer, targeted questions consistently outperform longer surveys on both response rate and data quality.
How often should you run employee pulse surveys?
Quarterly is the most common cadence — it aligns with business reporting cycles and gives teams time to act before the next survey. Monthly works for fast-moving organizations or periods of significant change; bi-annual suits smaller teams with limited HR bandwidth.
What is the difference between a pulse survey and an employee engagement survey?
Annual engagement surveys are comprehensive — Culture Amp's standard template runs 57 questions. Pulse surveys are short (5–20 questions), frequent, and designed to track trends and monitor specific drivers over time. Both tools serve different purposes and work best used together.
What is a good response rate for an employee pulse survey?
Culture Amp considers 75–80% participation strong. Perceptyx reports average pulse participation at 67%, versus 79% for full census surveys. Rates below 50% typically signal concerns about anonymity, poor communication about the survey's purpose, or a history of feedback going unacknowledged.
How do you ensure employees respond honestly to pulse surveys?
Guaranteed anonymity is the single most important factor — particularly for sensitive topics like leadership effectiveness, DEI, and psychological safety. Platforms that technically enforce anonymity, so neither the provider nor the employer can trace individual responses, consistently produce more candid and actionable results. AnonyMoose is built on this principle by design.
What should you do after collecting pulse survey results?
Analyze within one week. Share high-level findings with all employees within two weeks. Identify 2–3 priority action areas, assign owners and timelines, and report progress at the start of the next survey cycle. Making this loop visible and consistent is what builds the trust that sustains high response rates over time.